The Overview
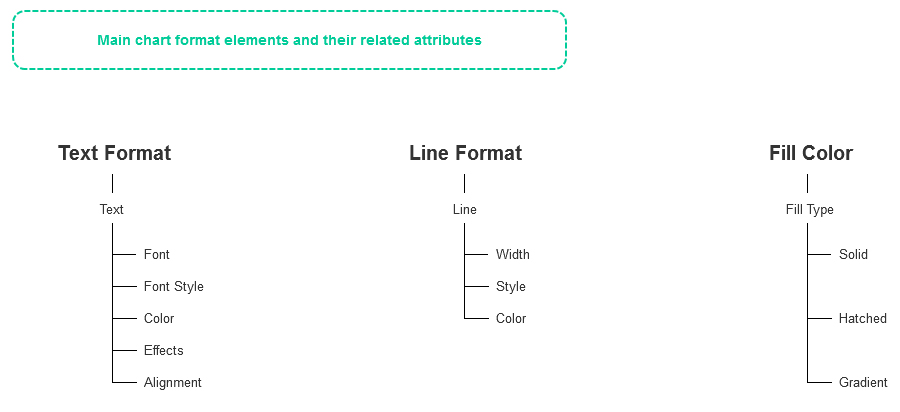
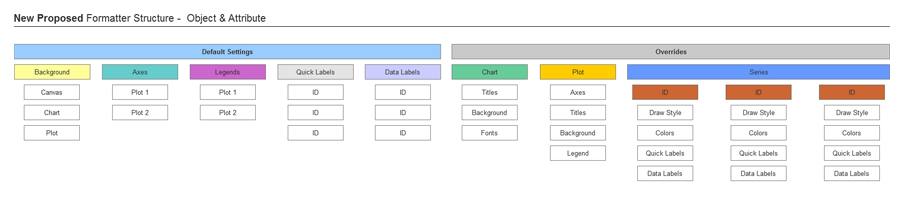
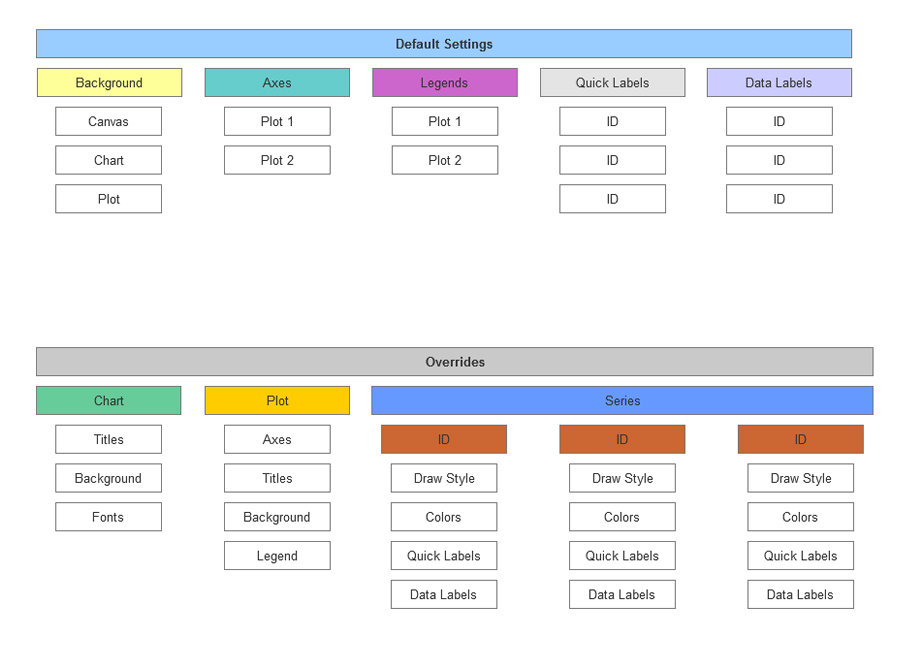
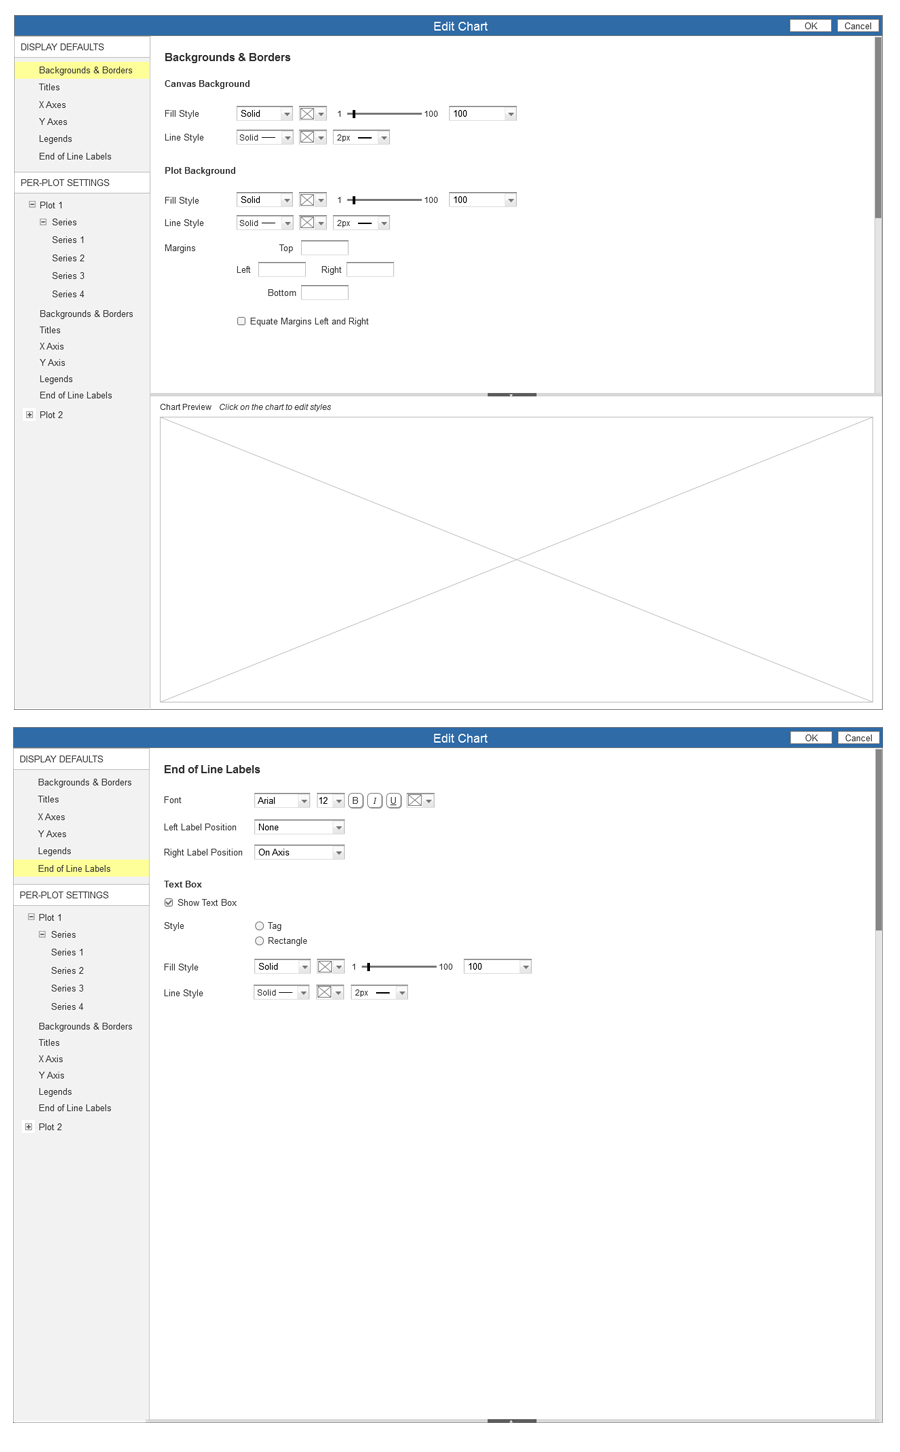
The chart formatter is an engine that reads a chart display and allows users to edit and format the data's aesthetics and its layout's overall look and feel. Users can customize every object on a chart anywhere from legends to axes, titles to series, and background colors to font styles.

The Problem
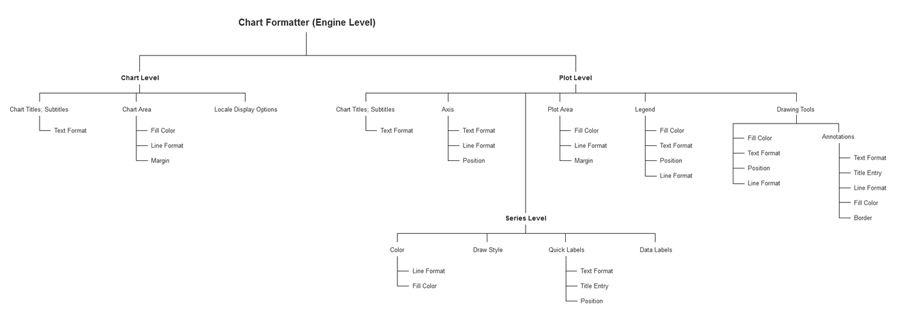
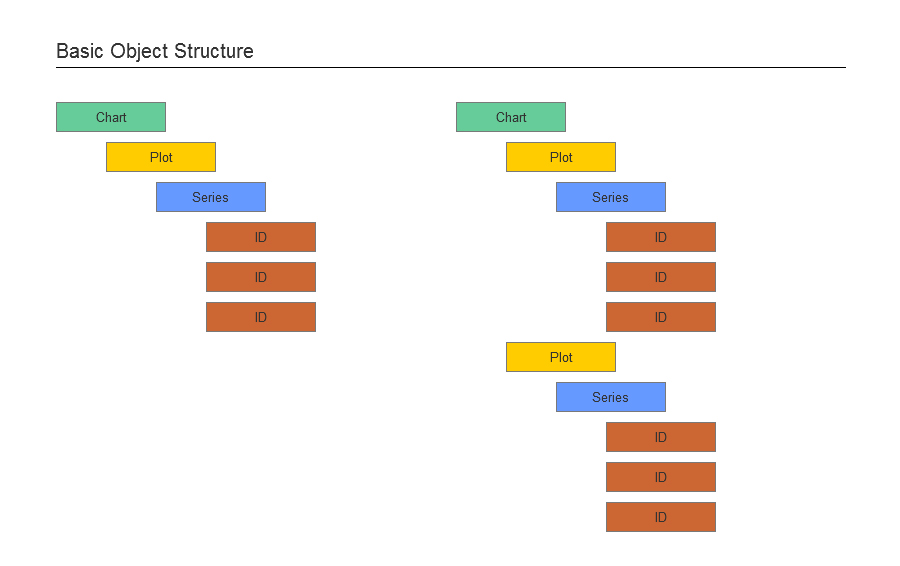
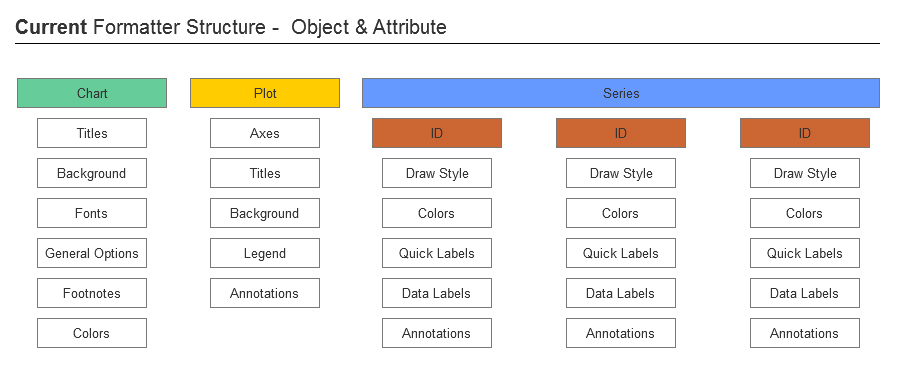
The formatter, used across FactSet's 5 charting applications, has been part of many rounds of feature implementations, resulting in an engine filled with element functionality, feature additions, and a level to object structural disorganization. It was in need of an architectural restructure and an overall informational and visual redesign to help users better utilize their workflows and efficiency while editing their charts.
Information Architecture
As the lead interaction designer and part of the redesign, I gathered information from the existing formatter and created a features list. From that, I created a features organization and information architecture which consisted of level, object, and attribute structural charts. With this information, it helped guide the overall design through each step of the design process.


Process Flow Diagram
Another part of the redesign that greatly helped and influence the overall design was creating a process flow diagram showcasing a typical user workflow.

The Wireframes
Finally, after all the information restructure, I created wireframes to show the newly designed and updated chart formatter. The process was both very iterative and collaborative. After being approved, the wireframes were passed on to the next phase of design - visual design.

